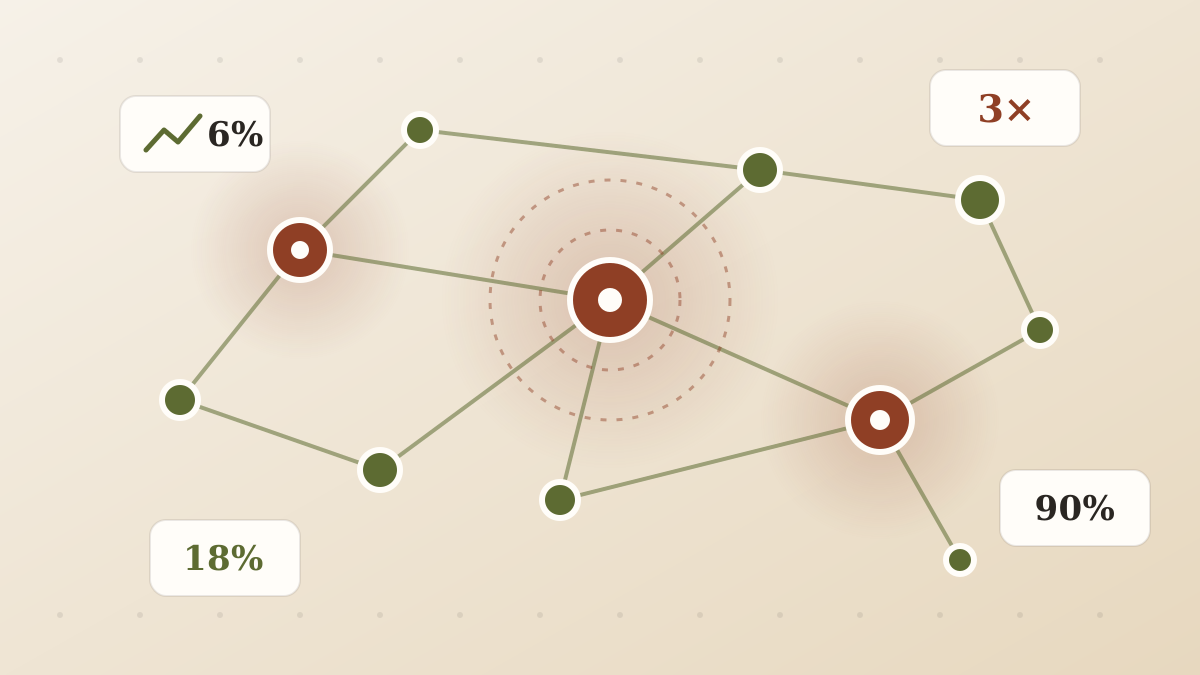
Ukraine's technology sector is often described with adjectives — resilient, adaptive, determined. Numbers describe it better. This map brings together the key figures from public research on how the ecosystem has grown, how it is valued and how its startups have kept building through years of extreme pressure.
Growth: tech as a pillar of the economy
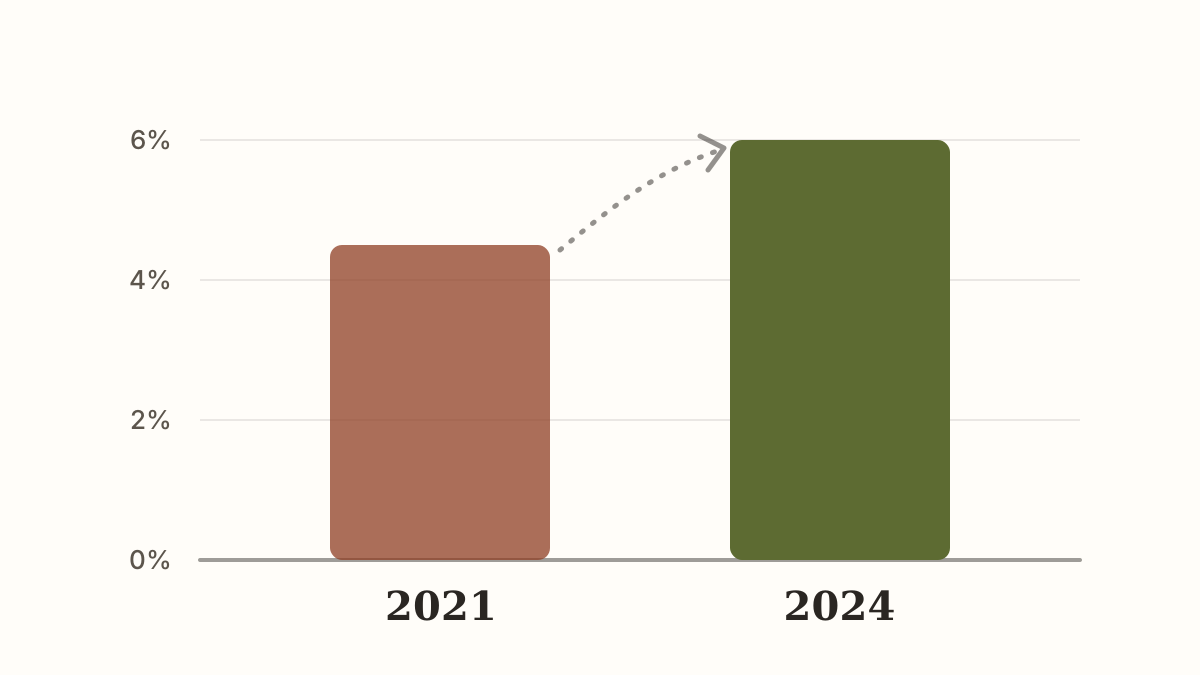
The most telling indicator is the sector's weight in the national economy. The share of IT in Ukraine's GDP increased from 4.5% in 2021 to 6% in 2024. That growth happened while many traditional industries were losing capacity, which means technology did not just survive — it took on a larger role in supporting the economy and foreign currency earnings.
Valuation: a threefold increase
According to the Civitta 2024 ecosystem report, the total valuation of Ukraine's startup ecosystem has tripled compared with 2020. The same report places Ukraine among the top three fastest-growing ecosystems in Central and Eastern Europe and fourth in the region by total ecosystem value.
Valuation is not the same as success, and it can change quickly. But a threefold rise over a period that included a full-scale war suggests that investors and founders have been building companies with real revenue and real customers, not just paper value.
Resilience: who keeps building
Two figures stand out when it comes to startup resilience:
- 18% of startups in the ecosystem were launched after the start of the full-scale invasion. New companies kept appearing, which points to a continuous cycle of innovation rather than a frozen market.
- 90% of founders surveyed for the Polish-Ukrainian Startup Bridge study see high growth potential for their projects, and almost half of the ecosystem rates its current performance as average or better.
At the same time, the pressure is real. About 75% of founders report a critical lack of funding. Resilience here does not mean the absence of problems; it means the ability to keep operating and growing despite them.
Key figures at a glance
- IT share of GDP: 4.5% (2021) → 6% (2024).
- Ecosystem valuation: three times higher than in 2020.
- Regional position: top three by growth in CEE, fourth by total ecosystem value.
- New companies: 18% of startups founded after February 2022.
- Founder outlook: 90% see high growth potential.
- Main constraint: around 75% face a critical lack of funding.
How to read this map
These figures come from different studies with different methods, so they should be read as a picture of direction rather than a single precise measurement. Together they tell a consistent story: a sector that grew in economic importance, attracted more valuable companies and kept producing new ones under conditions that would have stopped most ecosystems.
We will update this map as new reports are published. As always, every number here is attributed to a public source and checked against independent data before publication.
Resilience is not the absence of problems. It is the ability to keep building despite them — and the numbers show it. — Editorial team